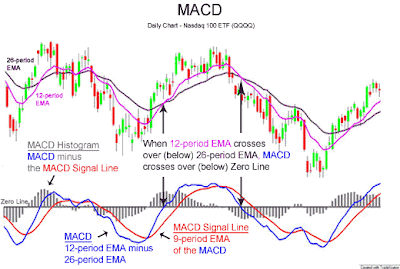
MACD
之前概括了几篇关于MA的文章,今天要详细概括一下MACD,还有MACD Histogram。MACD是一个相当重要的TA indicator,所以,非要认识不可。
MACD是由一个名位Gerald Appel的人开发出来的,全名是Moving Average Convergence Divergence。
Definition of MACD
MACD: 12-day EMA minus 26-day EMA.
Hence,
MACD is positive (above zero) when 12-day EMA is above 26-day EMA.
MACD is negative (below zero) when 12-day EMA is below 26-day EMA.
MACD is at zero when 12-day EMA equals 26-day EMA, ie. when the two EMA cross-over.
MACD signal line: 9-day EMA of the MACD. 
If MACD is positive and rising, then the gap between the 12-day EMA and the 26-day EMA is widening. This indicates that the rate-of-change of the faster moving average is higher than the rate-of-change for the slower moving average. Positive momentum is increasing, indicating a bullish period for the price plot.
If MACD is negative and declining further, then the negative gap between the faster moving average and the slower moving average is expanding. Downward momentum is accelerating, indicating a bearish period of trading.
MACD Bullish Signal
MACD generates bullish signal from 3 main sources:
1) Positive Divergence (of MACD and price)
MACD uptrend, price downtrend. MACD can either form as a series of higher Lows or a second Low that is higher than the previous Low. Positive Divergences are probably the least common of the three signals, but are usually the most reliable, and lead to the biggest moves.
2) Bullish Moving Average Crossover
Occurs when MACD moves above its signal line (its 9-day EMA). It's probably the most common signals and as such are the least reliable, therefore must be used in conjunction with other technical analysis tool.
Bullish Moving Average Crossovers are used occasionally to confirm a positive divergence. The second Low or higher Low of a positive divergence can be considered valid when it is followed by a Bullish Moving Average Crossover. Sometimes it is prudent to apply a price filter to the Bullish Moving Average Crossover to ensure that it will hold. An example of a price filter would be to buy if MACD breaks above the 9-day EMA and remains above for three days. The buy signal would then commence at the end of the third day.
3) Bullish Centerline Crossover
Occurs when MACD moves above the zero line and into positive territory. It's a clear indication that momentum has changed from negative to positive, or from bearish to bullish. After a Positive Divergence and Bullish Centerline Crossover, the Bullish Centerline Crossover can act as a confirmation signal. Of the three signals, moving average crossover are probably the second most common signals.

MACD Bearish Signal
MACD generates bearish signal from 3 main sources:
1) Negative Divergence (of MACD and price)
MACD downtrend, price uptrend. The Negative Divergence in MACD can take the form of either a lower High or a straight decline. Negative Divergences are probably the least common of the three signals, but are usually the most reliable, and can warn of an impending peak.
2) Bearish Moving Average Crossover
Occurs when MACD moves below its signal line (its 9-day EMA). It's probably the most common signals and as such are the least reliable, therefore must be used in conjunction with other technical analysis tool.
3) Bearish Centerline Crossover
Occurs when MACD moves below the zero line and into negative territory. It's a clear indication that momentum has changed from positive to negative, or from bullish to bearish. The centerline crossover can act as an independent signal, or confirm a prior signal such as a moving average crossover or negative divergence. Once MACD crosses into negative territory, momentum, at least for the short term, has turned bearish.

MACD Drawbacks
1) MACD is a lagging indicator, one way to overcome this is to use a MACD histogram.
2) MACD is not particularly good for identifying overbought and oversold levels. Even though it is possible to identify levels that historically represent overbought and oversold levels, MACD does not have any upper or lower limits to bind its movement. MACD can continue to overextend beyond historical extremes.
3) MACD calculates the absolute difference between two moving averages and not the percentage difference. MACD is calculated by subtracting one moving average from the other. As a security increases in price, the difference (both positive and negative) between the two moving averages is destined to grow. This makes its difficult to compare MACD levels over a long period of time, especially for stocks that have grown exponentially.
An alternative is to use the Price Oscillator, which shows the percentage difference between two moving averages:
(12 day EMA - 26 day EMA) / (26 day EMA)
The resulting percentage difference can be compared over a longer period of time. For the short term, MACD and the Price Oscillator are basically the same. The shape of the lines, the divergences, moving average crossovers and centerline crossovers for MACD and the Price Oscillator are virtually identical.
Venus
ps: The content and pictures of this article are excerpted from StockCharts and wikipedia.

No comments:
Post a Comment